

Linear Inequalities
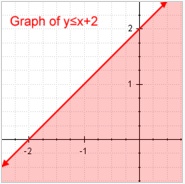
Inequalities, unlike equations, commonly have an infinite number of solutions. Graphing them is easy. First, graph the inequality as if it were an equation. If the sign is ≤ or ≥, graph a normal line. If it is > or <, then use a dotted or dashed line. Then, shade either above or below the line, depending on if y is greater or less than mx + b. As an example, the graph of y ≤ x + 2 is provided below:
Example: